DevTools/Performance
Contents
Team
| Current Team | fitzgen, gregtatum |
| Previous Members | jsantell, vporof (moved to Project Tofino, but are still available for questions) |
| Product Management | |
| SpiderMonkey Liason | shu |
| Gecko Layout Liason | |
| Mailing Group | dev-developer-tools |
Overview
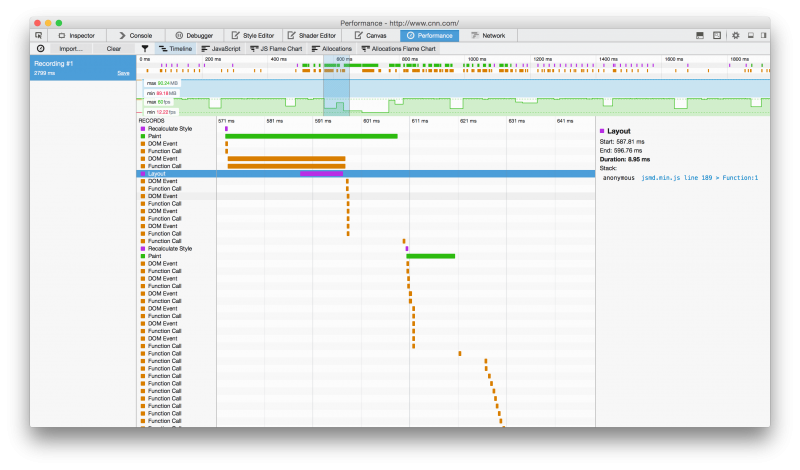
DevTools' Performance Tools are a set of tools designed to identify, locate and resolve jank and responsiveness issues in web applications, FxOS apps, and Firefox itself. There are currently three main views for inspecting sampling and marker data (waterfall, call tree, flame chart).
Some experimental views are currently available optionally, such as allocation views, and the JIT Optimizations view.
Bugzilla
Helpful Bug Searches
| Search | Description |
|---|---|
| Meta Bugs | The top-level bugs that are a good starting place to see what work needs to get done. Dependent bugs are set to block these meta bugs. |
| Good First Bugs | Looking for a place to start contributing? Pick up one of these bugs. |
| Bug Fixes | Help improve the quality of the tool by fixing bugs that impact the user. |
| All Open Bugs | All of the bugs open on the tool. |
| Priority P1 | The most important bugs being actively worked on. |
| Priority P2 | Important bugs that need to get done soon. |
| Priority P3 | The backlog of work to do. |
| Untriaged Bugs | New bugs that haven't been marked P1, P2, or P3. |
| Intermittents | Bugs filed on intermittent test failures. It's helpful to look them up on Orange Factor to see how often they are failing. |
Meta Bugs
| Title | Meta Bug | All Dependent Bugs | P1 |
|---|---|---|---|
| Bug Fixes | Bug 1307838 | List of all dependent bugs | |
| React DOM | Bug 1258642 | List all dependent bugs | Yes |
| JIT View | Bug 1143804 | List all dependent bugs | Yes |
| Redux | Bug 13224562 | List all dependent bugs | |
| Perf Tools Performance | Bug 1160330 | List all dependent bugs | |
| Performance Tools Memory Footprint | Bug 1191797 | List all dependent bugs | |
| Gecko Profiler parity | Bug 1176608 | List all dependent bugs | |
| console.profile | Bug 1173555 | List all dependent bugs | |
| Operation Instrument | Bug 1145271 | List all dependent bugs | |
| Performance Tool Allocations | Bug 1160812 | List all dependent bugs | |
| Gaming/Web VR enhancements | Bug 1196984 | List all dependent bugs | |
| Extensible Performance Tools | Bug 1173449 | List all dependent bugs | |
| Active Intermittents | Bug 1245886 | List all dependent bugs | |
| Remote Profiling (WebIDE) | Bug 1199284 | List all dependent bugs | |
| UI/UX Papercuts | Bug 1145697 | List all dependent bugs |
Goals
- Provide insight to issues related to performance in web applications
- Offer guidance and suggestions on fixing performance problem areas
- Approach feature parity with Gecko Profiler for layout, rendering issues (meta bug)
- A consolidated area for any team on Gecko to implement their own view to solve specific performance issues
Internals
There are two main sets of data used in a recording profile -- marker data and profiler data.
Profiler data is the same information as the previous Profiler tool and that the Gecko Profiler uses. This samples the JS executing at a specified rate, and also returns painting, layout and marker data that currently only the Gecko Profiler uses. This tool only uses the sampling information, which lets us calculate cost and timing of functions in JS, as well as what JIT optimizations were used for JS.
Marker data is currently based on ProfileTimelineMarkers. Gecko Profiler uses the underlying profiler to generate markers, whereas Performance Tools uses these ProfileTimelineMarkers, which are emitted via docshell in realtime, rather than fetched on demand. The FxOS Performance team uses the same marker information from User Timing APIs, which this tool should most likely strive for.
These two data sources are merged together in a final recording, with waterfall view using marker data, and the call tree and flame graph using profiler data. We also use Debugger.Memory information to collect allocation information to track down instances where allocation pressure causes jank.
Resources
- Performance Tools MDN Docs
- Gecko Profiler
- ProfileTimelineMarkers
- Debugger.Memory
- Operation Instrument
