Atana/idea
Spectrum Analysis(Fingerprint) Model
This relies on fingerprinting music based on spectrogram.
Basic steps of processing
- Preprocessing step: Includes fingerprinting comprehensive collections of music and storing fingerprint data in database (indexing)
- Extracting fingerprint of music(m) piece used as query
- Matching fingerprint of m against the indexed fingerprints
- Returning matched musics in relevance order
Advantage
It works on very obscure songs and will do so even with extraneous background noise
Implementation Details
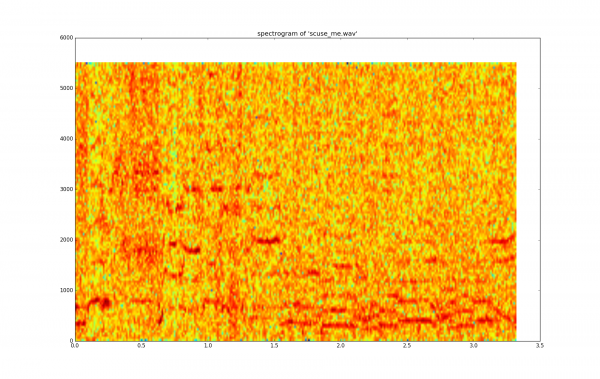
Idea here is to think of a piece of music as time frequency graph also called spectrogram. This graph has three axis. Time on x-axis, frequency on y-axis and intensity on z-axis. A line horizontal line represents a continuous pure tone, while vertical line represents sudden rise (burst) white noise.
sample wave file: scuse me
"""Spectrogram image generator for a given audio wav sample.
It is a visual representation of spectral frequencies in sound.
horizontal line(x axis) is time, vertical line(y axis) is frequency
and color represents intensity.
"""


import os
import wave
import pylab


def graph_spectrogram(wav_file):
    sound_info, frame_rate = get_wav_info(wav_file)
    pylab.figure(num=None, figsize=(19, 12))
    pylab.subplot(111)
    pylab.title('spectrogram of %r' % wav_file)
    pylab.specgram(sound_info, Fs=frame_rate)
    pylab.savefig('spectrogram.png')


def get_wav_info(wav_file):
    wav = wave.open(wav_file, 'r')
    frames = wav.readframes(-1)
    sound_info = pylab.fromstring(frames, 'Int16')
    frame_rate = wav.getframerate()
    wav.close()
    return sound_info, frame_rate


if __name__ == '__main__':
    wav_file = 'scuse_me.wav'
    graph_spectrogram(wav_file)
Points of interest are the points with 'peak intensity'. The algorithm keeps track of the frequency and the amount of time from the beginning of the track for each of these peak point. Fingerprint of the song is generated using these information.
Details of algorithm
Read the audio/music data as a normal input stream. This data is time-domain data. As we need to use spectrum analysis instead of direct time-domain data. Using Discrete Fourier Transform (DFT) we will convert the time-domain data to frequency domain so that it can be of use. The problem here is that, in frequency domain data we loose track of time. Hence, to overcome this problem we divide whole data into chunks of data and will transform just this bit of information. Basically, we will be using a small window size. For each of these small window we already know the time.
Using Fast Fourier Transform(FFT) on all data chunks we get a list of all the data about frequencies. Now, our goal would be to find interest points also called key music points to save these points on hash and try to match on them against the indexed database. It would be efficient since average lookup time for a hash table is O(1), i.e. constant. Each line of spectrum represents data for a particular window. We would be taking certain ranges say 40-80, 80-120, 120-180, 180-300. Our goal is to take points with highest magnitude from these ranges for each windowed data. These are the interest points or key points.
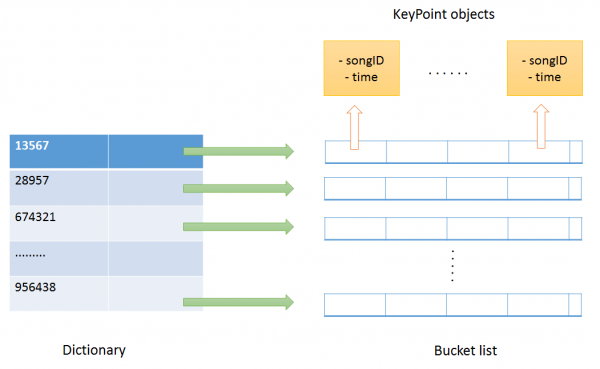
Next step is to use these key points for hashing and generate index database. Key points obtained form each window will be used to generate a hash key. In the dictionary, a hash key is used to obtain the bucketlist stored as value. Index of the bucketlist is songID and at each index value would be details stored in KeyPoint object.
class KeyPoint:
    def __init__(self, time, songID):
        self.time = time
        self.songID = songID
Using the above mentioned technique we can create index for the audio/music collections. Given a query audio we find fingerprint(contains Keypoints and time details) of that audio and will match against the indexed database to find similar audios. Important thing to keep in mind is that we are not just matching key points but time too. We must overlap the timing. We can subtract the current time in our recording (from query fingerprint) with the time of the hash-match (from indexed KeyPoint objects). This difference is stored together with the song ID. Because this offset, this difference, tells us where we possibly could be in the song. When we have gone through all the hashes from our recording we are left with a lot of song id’s and offsets. More the number of hashes with matching offsets more relevant is the song.
Reference Paper: http://www.ee.columbia.edu/~dpwe/papers/Wang03-shazam.pdf

