CodeCoverage/Firefly
Quick links: C/C++ coverage JS Coverage Bug Metrics
Contents
Overview
Introduction
Project Firefly is a Mozilla project about using code coverage data, bug data and Hg commit information to identify where we need to create test cases that will have the highest impact on preventing or quickly catching regressions.
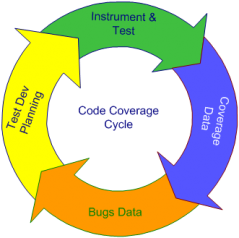
The following coverage cycle best describes our tactical approach.
- Test and Instrument - Build instrumented version of Firefox. Run all the test suites (manual and automated) to collect code coverage data.
- Coverage Data - Identify coverage gaps
- Bugs Data - Identify the number, nature and type of bugs reported and/or fixed in the product. These include total number fixed, number of regression/security/crash bugs, Also, the files that patches attached to bugs affect.
- Test Dev Planning - target test development at the highest priority, low coverage files.
Why
Impact of Code Coverage as sole instrument of decision analysis
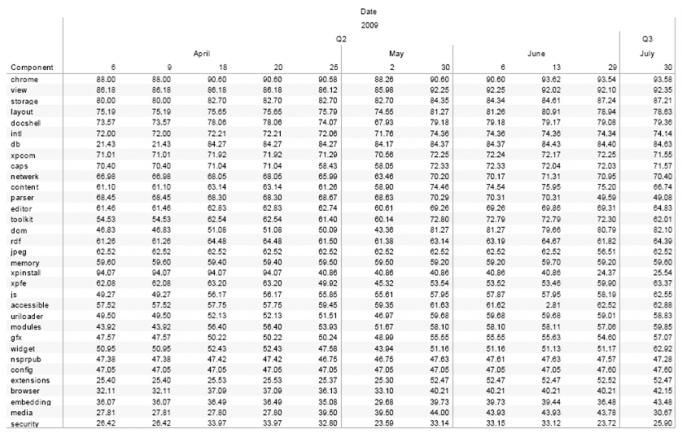
Code coverage data in isolation is a very incomplete metric in itself. Lack of coverage in a given area may indicate a potential risk but having 100% coverage does not indicate that the code is safe and secure. Look at the following example provided below. This is code coverage data grouped by component in the Firefox executable and the data is collected from automated test suites run only. Additionally there are a bunch of manual test suites that provide extra coverage.
Given the above information, one tends to gravitate towards low code coverage components to develop tests to improve product quality.
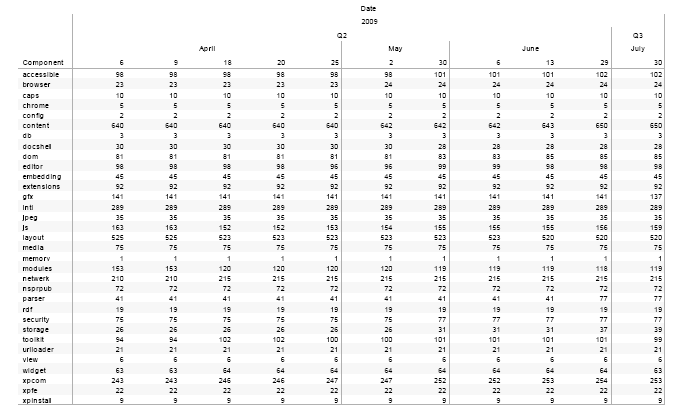
However, if you are provided an additional data point, like size of the component, you may realize that filling a 40% coverage gap in say Content gives you a bigger bang for the buck than improving 100% code coverage in xpinstall.
Based on the data from additional data point, you can clearly see that content, layout code coverage improvements give more bang for the buck.
But which files among those hundreds of files need first attention !!
Additional pointers for a better decision analysis
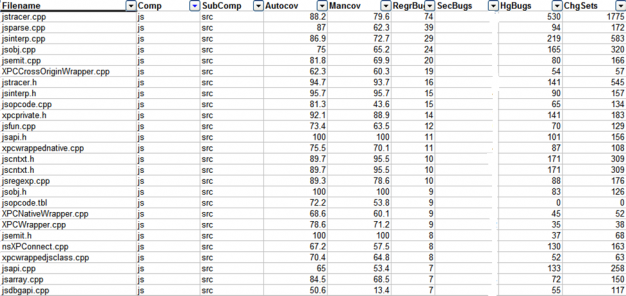
If, for each file, in a given component, if we have additional data pointers like number of bugs fixed for each file, the number of regression bugs fixed, number of security bugs fixed, number of crash bugs fixed, manual code coverage, branch coverage etc., we can stack rank the files in a given component based on any of those points.
That is what we have done in this exercise. We have generated data points for each file regarding the number of times it changed to number of different kinds of bugs fixed in the file to its coverage numbers in various test modes.
Download the full spreadsheet with these bugs stats here: results.xls.
How: Test Development Workflow
Once we look at the current data, we need a way to identify and record decisions on about which files will get special attention for test development.
This section describes the work flow for recording information about those priorities and decisions; and then process for starting, tracking, and completing work to build test cases and get them into automated test suites.
What: Code Coverage Reports and Tools
Code coverage runs happen on the weekends when extra build cycles area available. Shorter cycles are eventually planned if they prove useful.
The output of those runs are published at:
You can also instrument and run code coverage tools on your own builds. Here is how to do that
Major Accomplishments Timelime
- 08/06/09 - Discussion with JS team about Code Coverage
- 08/05/09 - Discussion with Content team about code coverage
- 07/11/09 - Completed first JS Coverage run
- 07/07/09 - Completed patch for serialized automated coverage runs, bug 502689
- 04/06/09 - First production code coverage run
- 03/25/09 - Presentation on Security coverage and bugs analysis
- 1/21/09 - First Brownbag about Code Coverage
Enhancement Requests
- Code inlining may show some code portions as not being covered [due to inlining]. Please generate coverage data with code inlining disbaled.
- We want Branch coverage data
- Need to have a side by side view of coverage data and MXR data
- Show the lists of test cases touching the source files.
- Create a testing->codecoverage category in bugzilla to file enhancement requests.
- bug 510232 Code coverage for Electrolysis
- XPINSTALL results should not be that low. There is supposedly a better test suite to test it to provide max coverage.
- A mail has been sent to Dave Townsend and Rob String to look at the test run logs located at http://ftp.mozilla.org/pub/mozilla.org/firefox/nightly/experimental/codecoverage/codecoverage-mozilla-central-logs.tar
- bug 510489 filed to investigate the log files decompression-corruption issue.
TestDev Planning based on Code Coverage Data
Aug-13-2009:: Tony Chung
As discussed in today's QAE meeting, these are the associated .js files along with the P1 feature ownership thats been defined in Tracy's feature ownership spreadsheet. Note that there are more files that touch these components in .cpp, .h, xul, xml, and other .js files. But this is a place to start.
Again, the point of this is to track look over missing areas of code coverage from the report, and see if there are existing litmus tests that provide test coverage. If neither manual or automated test coverage is available, please work with murali, clint, and the feature developer to determine what testcases need to be written (either automated or manual coverage)
Latest JS Coverage report: http://people.mozilla.org/~mnandigama/jscoverage-report/jscoverage.html
Feature Ownership spreadsheet: http://spreadsheets.google.com/ccc?key=0AkSa2kZ0OBffdE94NTdKcFFENEdfRE9OcmswUTFyM3c&hl=en
Addons Manager - Owner: tchung - extensionsManager.js
Audio Video - Owner: tchung - cpp files. no .js
Awesomebar - Owner: Tracy - nsPlacesTransactionService.js, nsPlacesUtil.js
Plugins - Owner: tchung - pluginGlue.js
Private Browsing - Owner: marcia - nsPrivateBrowsingService, nsHelperAppDlg.js
Security - Owner: Ashughes/Aakashd - nsSafebrowsingApplicaiton, BadCertHandler.js
TabbedBrowsing - Owner: Marcia/Henrik - nsDragandDrop.js, browser.js
I will work on the P2 and P3 feature coverage breakdown in another email.
FAQs
Q. Why are you providing line coverage?
- Line coverage data is the most basic information which helps us to quickly identify the coverage gaps and to come up with suitable test case scenarios.
Q. What about Functional coverage ? Why is functional coverage less than 100% for files that have 100% line coverage ? Look at the following scenario to prove my point!! . There is 100% line coverage but only 49.3% functional coverage.
- As you can see the details from here CLICK, this is an artifact of multi threaded applications running along with runtime generated functions.
- If more than one instance of a function is generated on the stack and if one of them acquires the lock on the thread and the other one goes out of scope before it could acquire a lock on the thread, the loser function will have zero coverage.
- Function coverage is the least reliable of all modes of code coverage. For instance, if there is a function with 1000 lines of code [ this is an exaggeration ] & with an if condition in the first 10 lines which throws the execution pointer out of the function block for not meeting a condition ... any such ejection from the 'if' branch also shows 100% function coverage where as we have barely scratched the surface of that function in reality.
Q. OK smart pants !! what about branch coverage ? Is it not the most meaningful of all modes of coverage ?
- You are right that branch coverage provides true sense of coverage.
- Branch coverage data helps identify integration test gaps, functional test gaps etc.,
- I have prototyped a C/C++ branch coverage strategy using 'zcov'
- I can present the findings from branch coverage to interested parties one on one.
- I do not have plans in place to implement a general availability of 'branch coverage' results in this Quarter.
Q. What are the known limitations of line coverage data ?
- If you have a multi conditional line like if(test)?dothis:dothat, even if both conditions are not tested, line coverage counts this line as covered.
- If you have if(this&that||whatever) , the line would be shown as covered for testing one condition even if the rest are not covered.
- Inlined functions may appear as not being covered.
- But the important point is these discrepancies would generate a statistically insignificant variations in the coverage %.
- When we pick up critical files we should not only pay attention to uncovered lines, but also to multi branch lines as well.
Q. What is the format in which you are presenting the code coverage results analysis ?
- The data would look like this
- For each file in the Firefox executable, you can see the Automated tests code coverage %, Manual tests code coverage %, Number of fixed Regression bugs, Number of fixed bugs [ as calculated from the change log of source code control system ] and the number of times a file is modified in the HG source control.
- The data can be grouped by Component/Sub component, ordered by Top files w.r.t changes or Top files w.r.t. Regressions or Top files w.r.t general bug fixes etc.,
- Depending on the criteria you can select top 10 or 20 files from any component of you interest and you can check the code coverage details [ line coverage ] from the FOLLOWING LINK.
- Mozilla community can work together to identify suitable scenarios to write test cases to fill the coverage gaps efficiently and effectively.
Q. What components that you recommend for first round of study ?
- Please check the following PDF files
- Component sizes in multiple coverage runs
- Coverage numbers from multiple code cov runs
- Coverage trend graphs by component
- Based on the component size Content,Layout,Intl,xpcom,netwerk,js are the components to study.
- Our goal is to identify 10 files in each of these components to improve code coverage.
Q. You wrote in previous posts that code coverage runs on the instrumented executable do not complete test runs due to hangs and crashes. What exactly is crashing? I don't see any inherent reason why an instrumented build would be "more sensitive to problems", unless the instrumentation itself is buggy !!
- one example: instrumentation changes the timing, which can change thread scheduling, which can expose latent threading bugs.We see it with Valgrind relatively often -- bugs that occur natively but not under Valgrind, or vice versa.
- You can pick up any dynamic instrumentation tool of your choice. You can find more bugs with it as opposed to optimized build.
Q. Ok!! Show me how did you arrive at these conclusions. How can I do it by myself ?
- I would be glad to explain that. Buy me a beer :)
Q. Why are we doing this ?
- My best answer is actually provided by Richard Feynman.


